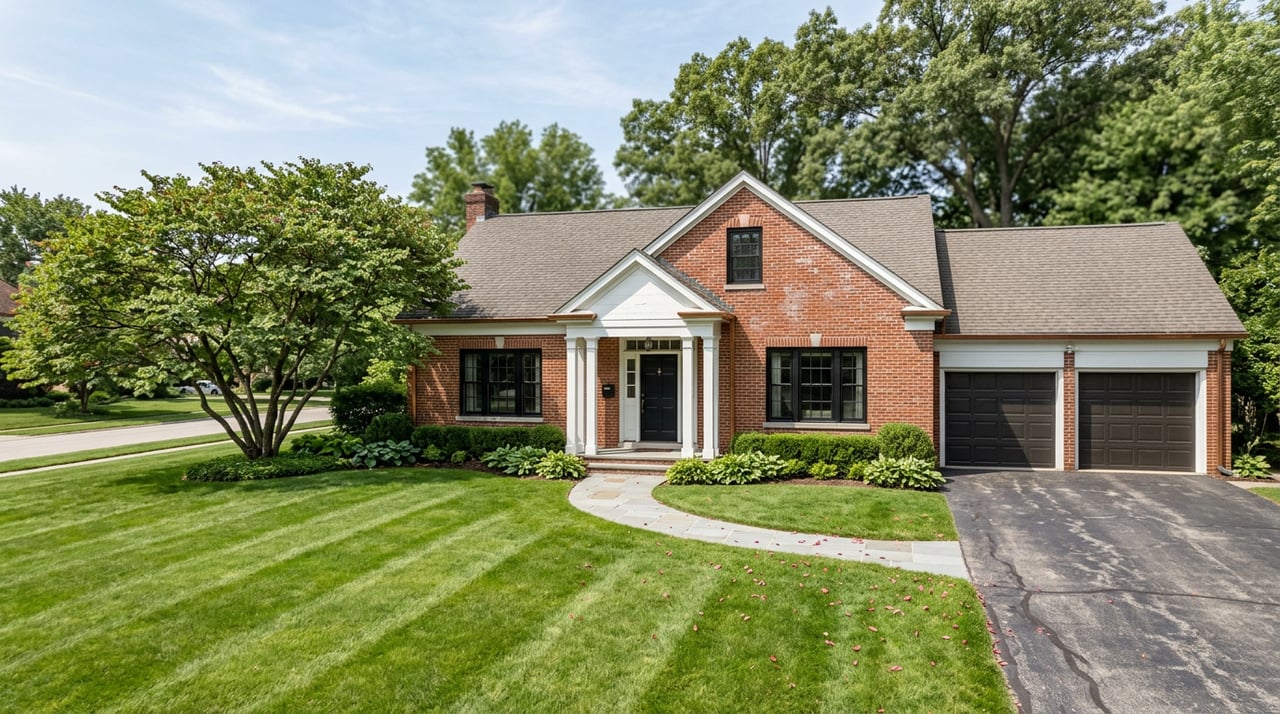
The Zoning Line That Splits Bethlehem's Housing Market in Two
September 17, 2026
September 17, 2026
Somewhere between Lehigh University's campus and the row of twins climbing the hill toward Fountain Hill, there's a line that never shows up on a listing photo. It isn't a school district boundary or a flood zone. It's a zoning overlay, and it changes who you're actually bidding against when you make an offer on a house.
Bethlehem's Student Housing Zoning District, formally Article 1327 of the city's zoning ordinance, was revised by City Council in 2020 in a vote that limits where houses in the Southside neighborhoods around Lehigh can legally be rented to groups of unrelated students. The change extended exemptions that already applied in a separate industrial-redevelopment-residential district, and the administration at the time framed it plainly: the goal, according to city officials quoted by WFMZ, was that the measure "would stabilize and protect neighborhoods" while still preserving housing families could afford. Lehigh's own housing office tells students the same thing from the other direction, advising them to check the overlay map before signing a lease, because it determines whether a given house can legally hold three, four, or five unrelated students.
That single administrative line is why two houses three blocks apart in Bethlehem can behave like they're in different cities.
Inside the overlay, a house isn't just a house. It's a bedroom count. Active listings in South Bethlehem near Lehigh routinely market that fact directly, describing properties as sitting "within the City of Bethlehem's desirable Student Overlay District" and pitching the math in terms of gross and net rental income rather than square footage or curb appeal. One recent single-family listing in Bethlehem was marketed as a stabilized brick rental producing roughly $21,540 in gross annual rent and $18,603 net, the kind of return an investor underwrites against a mortgage payment, not the kind of number an owner-occupant weighing location, layout, and outdoor space is considering.
That's the mechanism. An investor bidding on a house inside the overlay is solving a different equation than an owner-occupant bidding on the same house. If the per-bedroom rent pencils out, the investor can justify a price an owner-occupant never would, because the owner-occupant is paying for a place to live and the investor is paying for a stream of rent checks. Lehigh's own affiliate housing, SouthSide Commons, is operated by Greystar under a direct agreement with the university.
Outside the overlay, buyers can still have different priorities.
Look at Bethlehem's citywide figures and the market reads as merely competitive. As of September 2026, homes listed to buy in the city carried a median list price of $425,000, at $206 per square foot, spending a median of 20 days on the market. Pulled back a few months to the three-month window ending April 2026, Redfin had the median sale price at $318,000, up 10.4% year over year, with homes drawing an average of nine offers and closing in around nine days.
Those are city-level averages, and they blend two buyer pools with different priorities.
Northeast Bethlehem, a submarket with no meaningful proximity to the overlay, tells a cleaner story. Over the three months ending May 2026, homes there sold for a median of $395,000, up 17.0% year over year, at $230 per square foot. They moved fast, an average of seven days on market compared to eight the year before, with 52 homes sold in May 2026 versus 42 the year prior. That submarket is appreciating faster than the city as a whole.
An early-2026 neighborhood breakdown put West Bethlehem's single-family median at $318,300. Citywide, the same snapshot showed the overall median sale price at $339,800, with single-family homes alone running a $360,000 median and townhomes at $299,900.
Here's the table version, so the spread is easier to hold in your head at once:
| Submarket | Approx. median | Notable detail |
|---|---|---|
| Northeast Bethlehem | $395K (3 mo. ending May 2026) | Up 17.0% YoY, avg. 7 days on market |
| West Bethlehem | $318,300 (early 2026) | Owner-occupant driven, no overlay overlap |
| Citywide (all types) | $339,800 (early 2026) | Blends every submarket above and below |
| South Bethlehem (overlay area) | Not a clean median | Priced on rental yield, not comps alone |
That last row is the point. South Bethlehem inside the overlay doesn't have a clean, comparable median the way Northeast Bethlehem does, because a meaningful share of what sells there isn't priced against nearby owner-occupant sales. It's priced against what the house can earn as a rental, which is a different number entirely and one that moves with student enrollment and rent trends more than with the priorities shaping owner-occupant demand elsewhere in the city.
Bethlehem buyers are already used to checking one overlay, the historic district review boundary that governs what a homeowner can change about a facade. This is a second, unrelated line, and conflating the two is an easy mistake. The historic district boards care about architectural review. The student housing overlay cares about occupancy limits. A house can sit inside one, both, or neither, and each one changes a completely different part of the transaction.
If you're touring in South Bethlehem and a listing agent mentions the overlay, or the listing itself markets bedroom count and rental yield instead of finishes and layout, that's your signal you may be bidding against an investor rather than another owner-occupant. That doesn't mean walk away. It means your offer strategy and your appraisal expectations should account for the fact that comparable sales in that immediate footprint may include investor purchases priced off rent rolls, not off what an owner-occupant would pay to live there.
If you're shopping Northeast Bethlehem or West Bethlehem, the overlay distinction may not be part of the comparison. Northeast Bethlehem's 17% year-over-year growth is another measure of recent market activity.
Ask whether the specific address sits inside the Student Housing Zoning District before you assume a neighborhood's reputation tells you anything about your competition. Lehigh's own housing office publishes the parcel-level map for exactly this reason, because it determines legal occupancy limits, and it's worth checking regardless of whether you're a student, a family, or an investor.
The city's median price will keep blending these two buyer pools into one number every quarter. It won't split them for you. That's a conversation worth having with someone who tracks the difference block by block.
If you're comparing Bethlehem submarkets and want a read on which side of a specific line a house sits on, Jamie Elstner can walk through it with you. Let's Connect.
This article is general information, not legal, tax or financial advice. Consult a qualified professional about your situation.
Stay up to date on the latest real estate trends.
When you work with Jamie, you gain a knowledgeable advocate dedicated to protecting your interests, simplifying the process, and helping you achieve your real estate goals.